Use Success Tracking to Assess Efficiency of Your Product Finder
Introduction
While Overview Reports are generated as soon as you've published the Product Finder and are based on the click-out (user selecting a product from the recommendations) as the main KPI of the Product Finder usage, Success Tracking is based on actual sales and profit gained by the Product Finder. The functionality will be available as soon as Success Tracking has been integrated to your webpage and at least one purchase has been registered.
From this article you can learn:
1.How to Access the Success Tracking Data
Success Tracking Data is available on the Dashboard and in the Sales Reports.
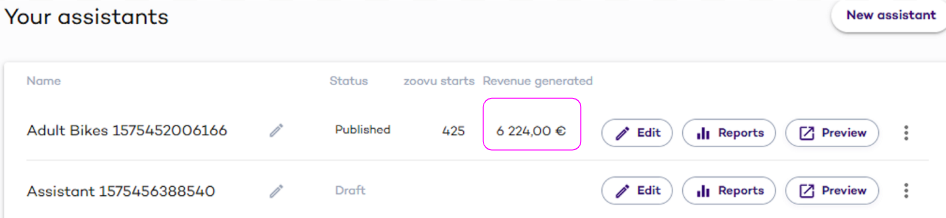
1.1 Revenue Generated Info on the Dashboard
Whenever you open the Dashboard, the Revenue generated is displayed for all the Product Finders with active Success Tracking. The "Revenue generated" is a total sum of all direct and indirect sales.
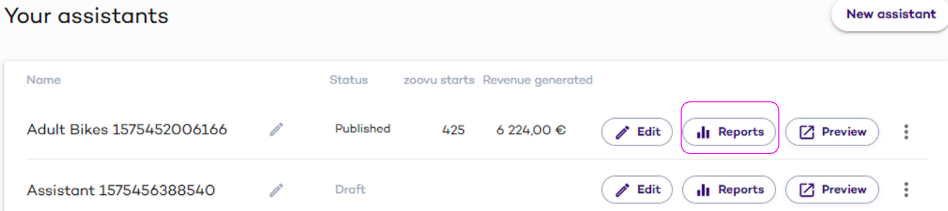
1.2 Success Tracking Details in the Sales Reports
Most of the Success Tracking details are available in the Sales Reports (along with all the information that's usually available in the Overview Reports). To get to the Sales Reports tab, open the Dashboard, and click the Reports button by the Product Finder you want to review.The Overview reports window will emerge. Click the "Sales" header to switch.
2.The Terms and KPIs used
Recommended, Selected and Bought Products
As you know, different products can be mapped to different answers in the Product Finder. The product displayed in the Product Finder based on the prospect's answers is called "recommended"
Once the visitor has proceeded to view the details of a recommended product from the Product Finder, the product is "selected".
If the visitor was recommended a product in the Product Finder and bought it not later than within 60 minutes since the last action in this Product Finder, the product is "bought" and "directly influenced"
If the visitor was recommended a product in the Product Finder and bought it later than 60 minutes after the last action in this Product Finder, the product is "bought" but "indirectly influenced"
2.1. Other KPIs
Overview reports are based on a number of KPI aimed to assess how successful the digital Product Finder is.
The following KPIs are used:
Visit: Each browser session within which a user has opened an Product Finder (we'll call such user - a "visitor")
Engaged visit: Each visit, during which the visitor has answered at least one question of the Product Finder
Product Finder 360 start: Each time the Product Finder has been started during an engaged visit
Click-through: Each time a product was selected.
Completion: Each time the visitor selected a product or reached the final screen of the Product Finder.
Direct sale: Each time a product was recommended and bought not later than within 60 minutes since the last action in this Product Finder,
Indirect sale: Each time a product was recommended and bought but later than within 60 minutes since the last action in this Product Finder,
3. Reports Description
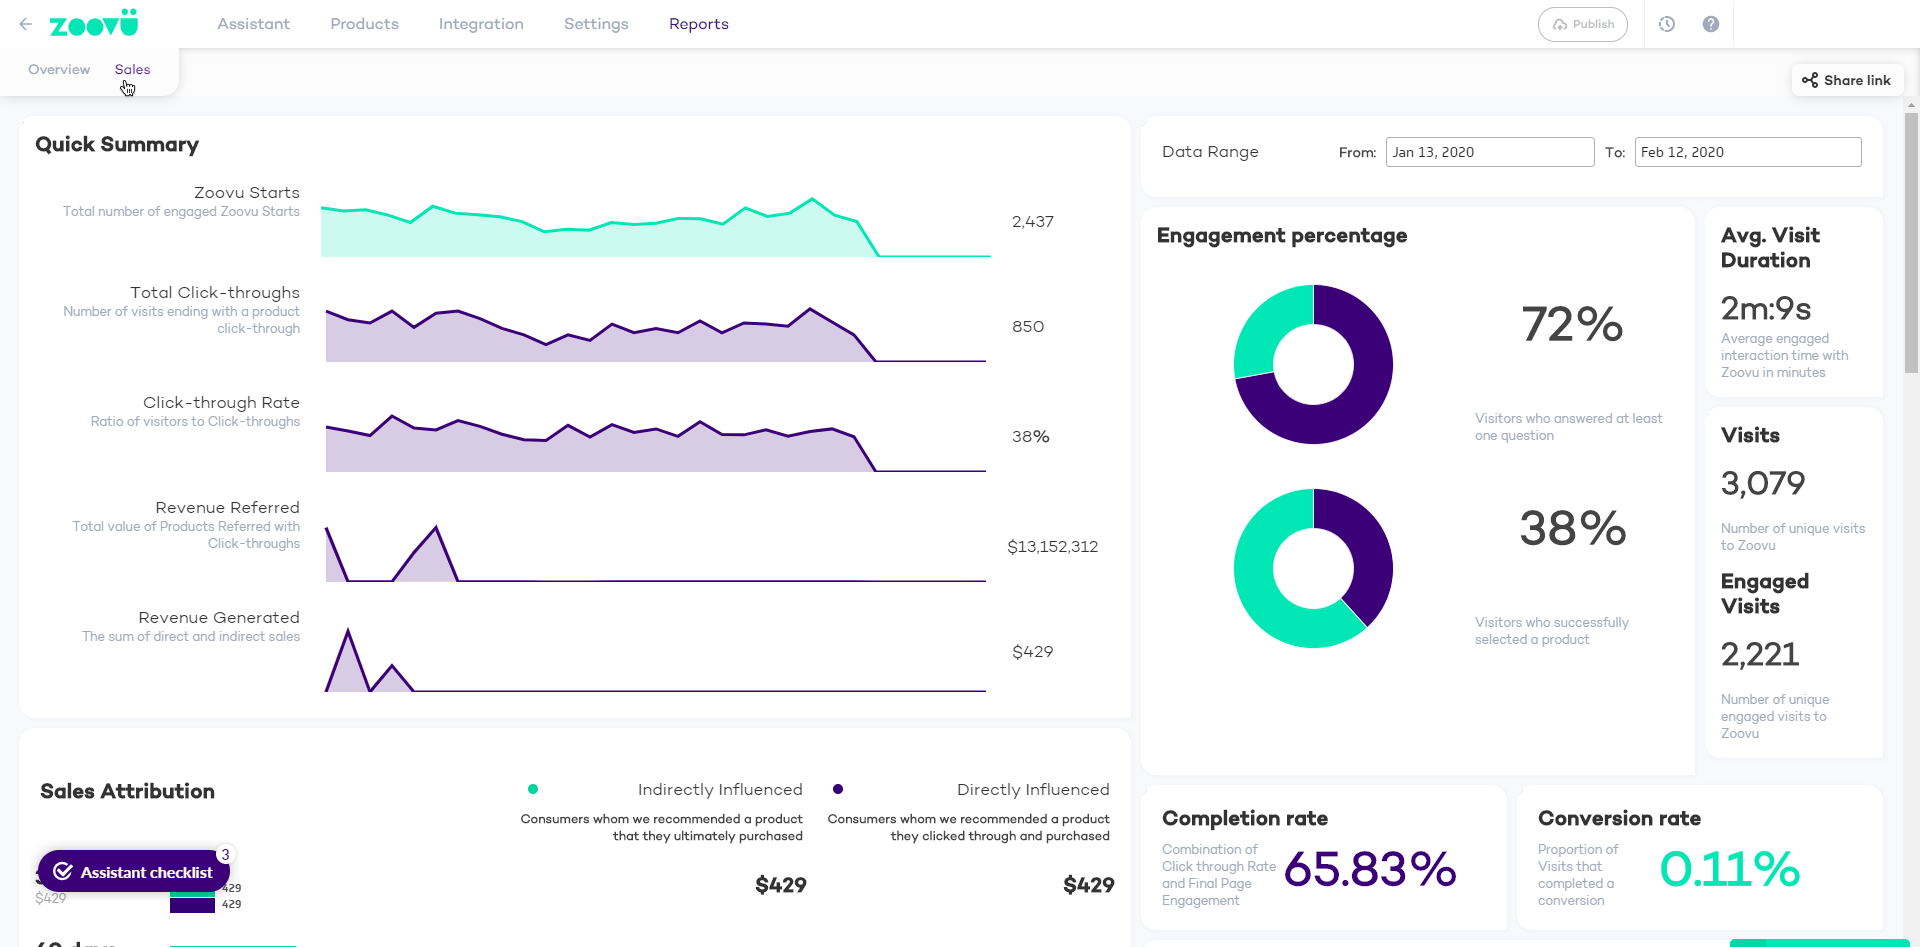
3.1 Quick Summary Chart
This comprehensive chart (located in the top left corner of the Sales report tab) provides insight into the general performance of your digital Product Finder.
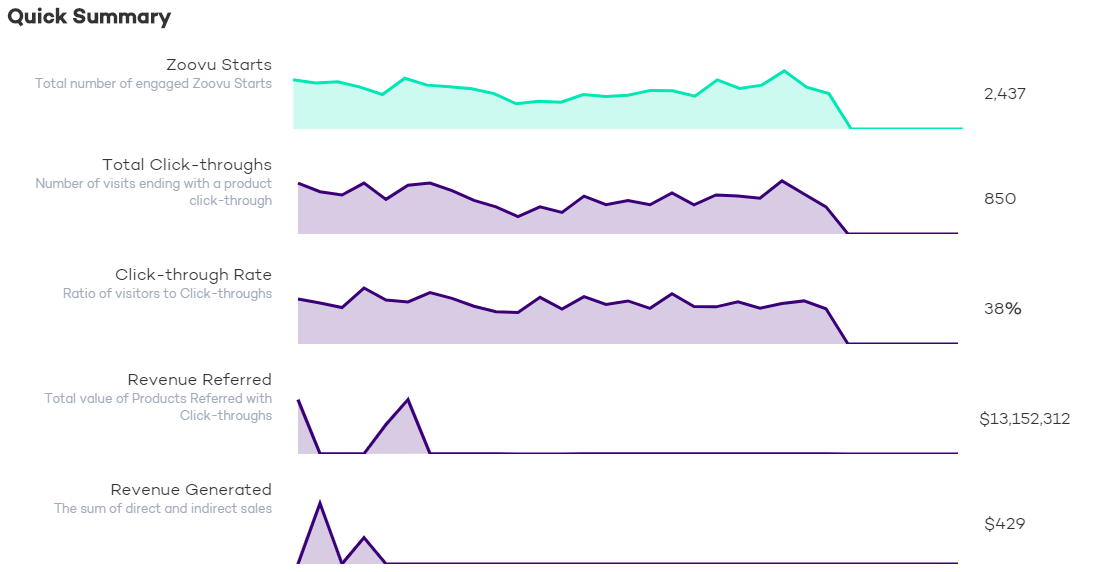
Product Finder 360 Starts: The total number of Product Finder 360 starts on a specific day and within the whole time period.
Total Click-throughs: The total number of click-throughs on a specific day and within the whole time period.
Click-through Rate: Percentage of visits that ended up with a selection of a product (of all engaged visits).
Revenue Referred: Total value of the products viewed by the visitors from the Product Finder.
Revenue Generated: Total value of all direct and indirect sales.
| Each value is displayed for the whole reporting period and can be viewed for a specific day. To see the value for a day, hover the mouse to a point on the chart axis | 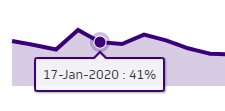 |
3.2 Customer Engagement Reports
To the right from the Quick Summary, there is a set of reports that will help you assess the overall engagement of the visitors with the Product Finder during the reporting period.
Engagement percentage: the upper donut graphs, that show for which percent of the total visits at least one question was answered. Selected percentage: the donut graph just below it shows the percentage of visits that ended up with a selection of a product (from all engaged visits). Below the donut graphs, you can see the following percentage values:
| 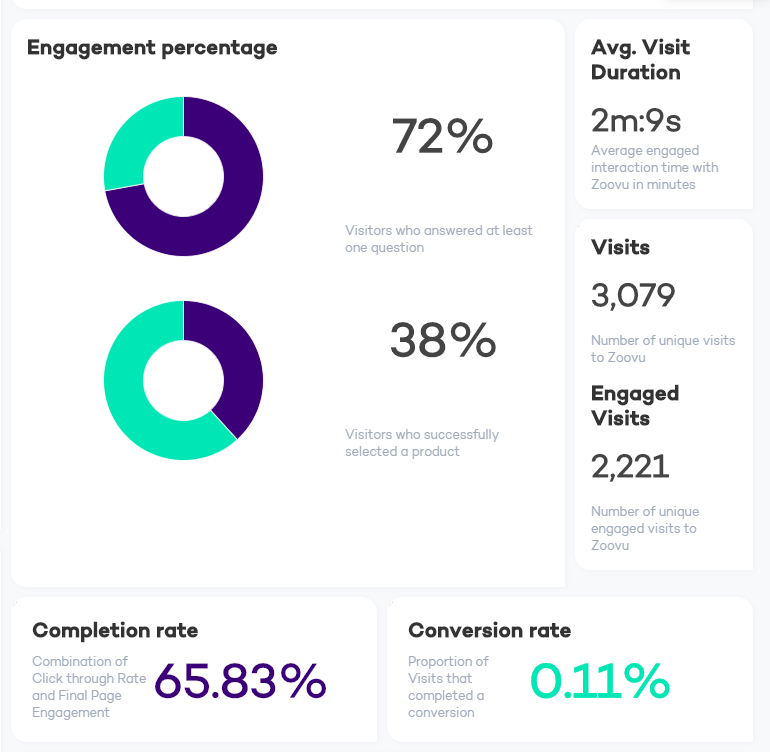 |
Conversion rate: the percentage of all engaged visits that ended with a direct or indirect sale.
To the right of the donut graphs, there are some more numbers:
Average Visit Duration: Total time of the engaged visits divided by their number
Visits: Number of all visits during the reporting period
Engaged Visits: Numer of all engaged visits (at least one question was answered)
3.3. Device and Browser Reports
The section is dedicated to the Product Finder's usage on different devices and via different browsers. It's usually located below the Quick Summary chart.
Total Device Category and Browser Share
With these easy-to-comprehend pie-charts, you can get an insight on the specifics of your visitors and adjust the Product Finder correspondently. The Total Device Category report considers three types of devices:
The Browser Share chart will include all the browsers that have been used for engaged visits. Both reports are generated using totals for the reporting period. | 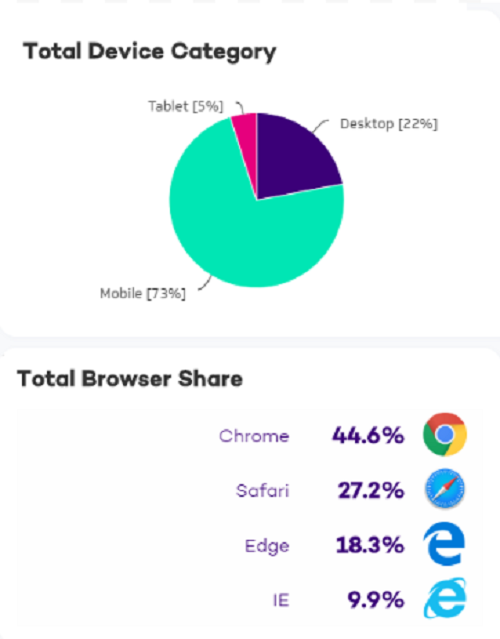 |
KPIs by Device Type and by Browser
With these table reports, you can get a deeper insight into the usage specifics, and check if the Product Finder lacks efficiency when used via a specific device or browser.
The following KPIs are provided for each device category and browser:
| 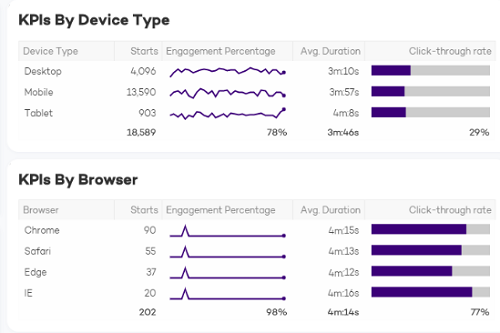 |
3.4. KPIs Report
| This generalized view of the KPIs for the reporting period. The report shows how the number of visits and engagement rate has been changing during the reporting period. | 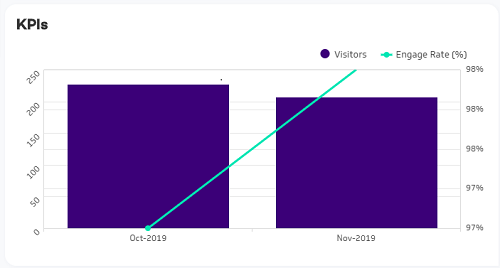 |
3.5. Product Reports
At the bottom of the page, you can learn which of the products have been the most and the least popular with your customers. While in the Overview reports, it is assessed to the products being clicked at, in the Sales reports it's related to the products being bought.
There are several reports:
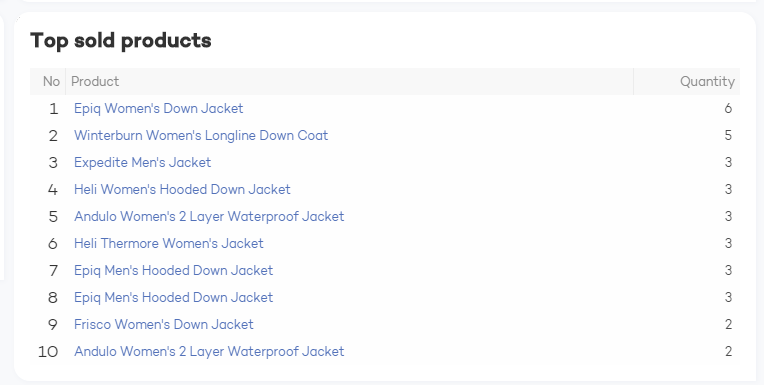
3.6. Top Sold Products
This report is just a list of the 10 products that were sold in the biggest quantity within the reporting period. The product that was sold most is rated first.
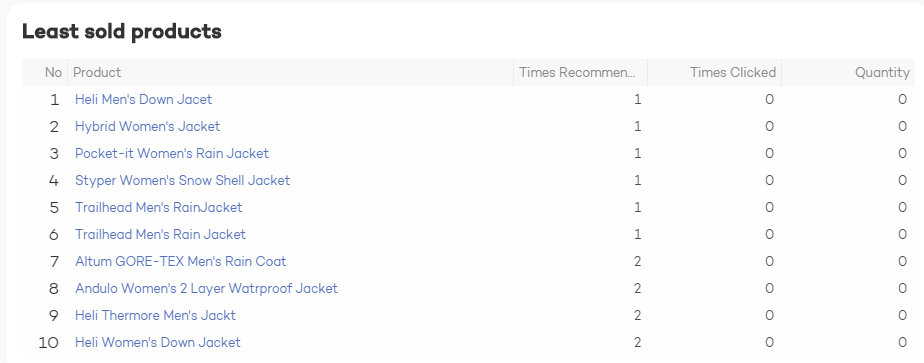
3.7. Least Sold Products
At the bottom of the reports window, you can see the products that have been recommended but have been sold least.
3.8. Most Efficient and Best Selling Products
In between the top and least sold products, you can see more details of the most efficient and best-selling product.
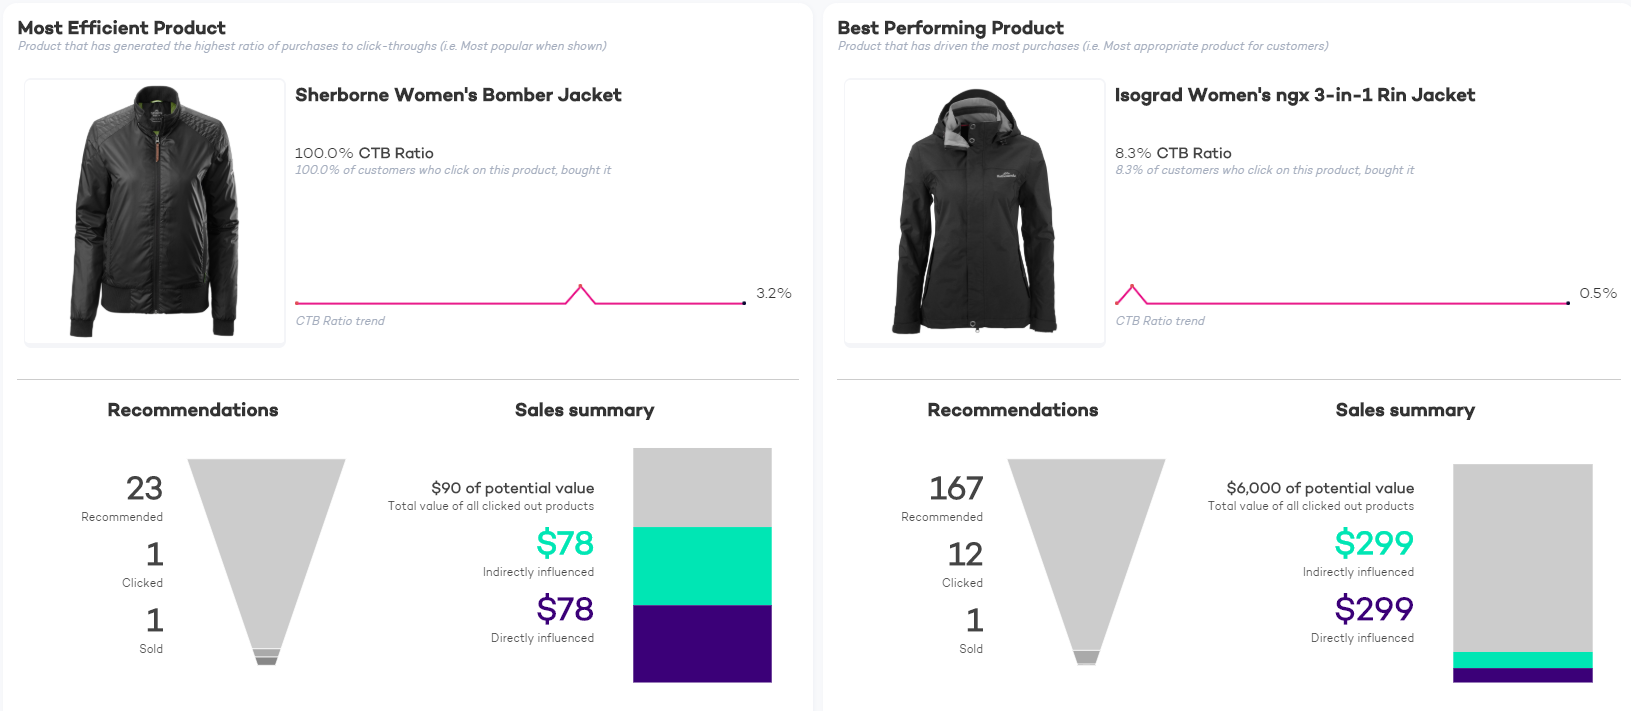
The report shows:
The Most Efficient Product: The product with the highest ratio of the times the product was bought (directly or indirectly) to the times it was recommended.
The Best Performing Product: The product that has been bought most within the reporting period. If several products have been bought the same number of times, the product that has been selected most is rated higher. Out of the two products that have those two parameters equal, the product that brought a bigger revenue within the reporting period is chosen.
Imagine, that a very peculiar product may be recommended quite rarely, but when it does, the visitors usually proceed to buy it - it won't be the best performing but will be the most efficient.
For each specific product, you can see:
| 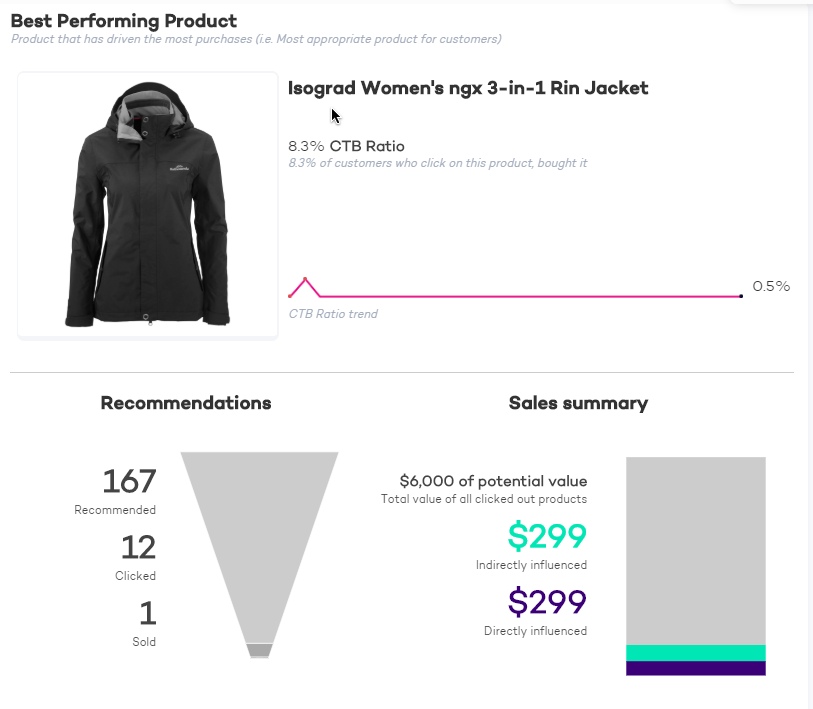 |
You can also see, the basic numbers related to the product:
Recommended: how many times the product has been displayed in the Product Finder
Clicked: how many times a visitor has selected to view the product details
Sold: how many times a direct or indirect purchase of this product has been performed.
4. Change Reporting Period
| You can always redefine the reporting period of the Overview Reports. This is done in the calendar in the top right corner of the tab. | 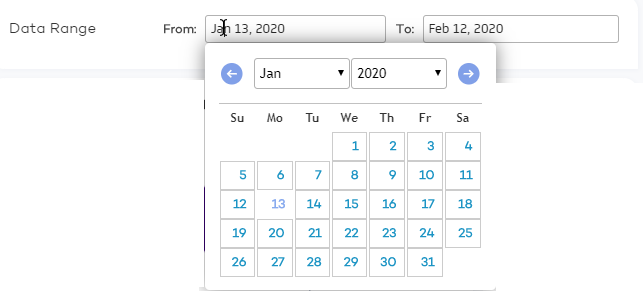 |