Use Overview Reports to Check Efficiency of the Product Finder
Introduction
Creating a digital Product Finder is really important, but the next most important thing is to make sure that it's working efficiently. That's why we've created a comprehensive set of Overview Reports based on the statistical data of the Product Finder usage.
From this article you can learn:
How to Access the Overview Reports
To get to the Overview Reports tab, open the Dashboard, and click the Reports button by the Product Finder you want to review.
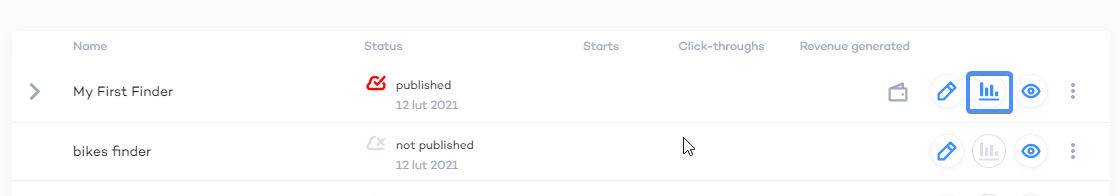
The Overview reports window will emerge.
Terms and KPIs used
As you know, different products can be mapped to different answers in the Product Finder. The product displayed in the Product Finder is called "recommended"
Once the visitor has proceeded to view the details of a recommended product from the Product Finder, the product is "selected".
Overview reports are based on a number of KPI aimed to assess how successful the digital Product Finder is.
The following KPIs are used:
Visit: Each browser session within which a user has opened an Product Finder (we'll call such user - a "visitor")
Engaged visit: Each visit, during which the visitor has answered at least one question of the Product Finder
Product Finder 360 start: Each time the Product Finder has been started during an engaged visit
Click-through: Each time a product was selected.
Completion: Each time the visitor selected a product or reached the final screen of the Product Finder.
Reports Description
Quick Summary Chart
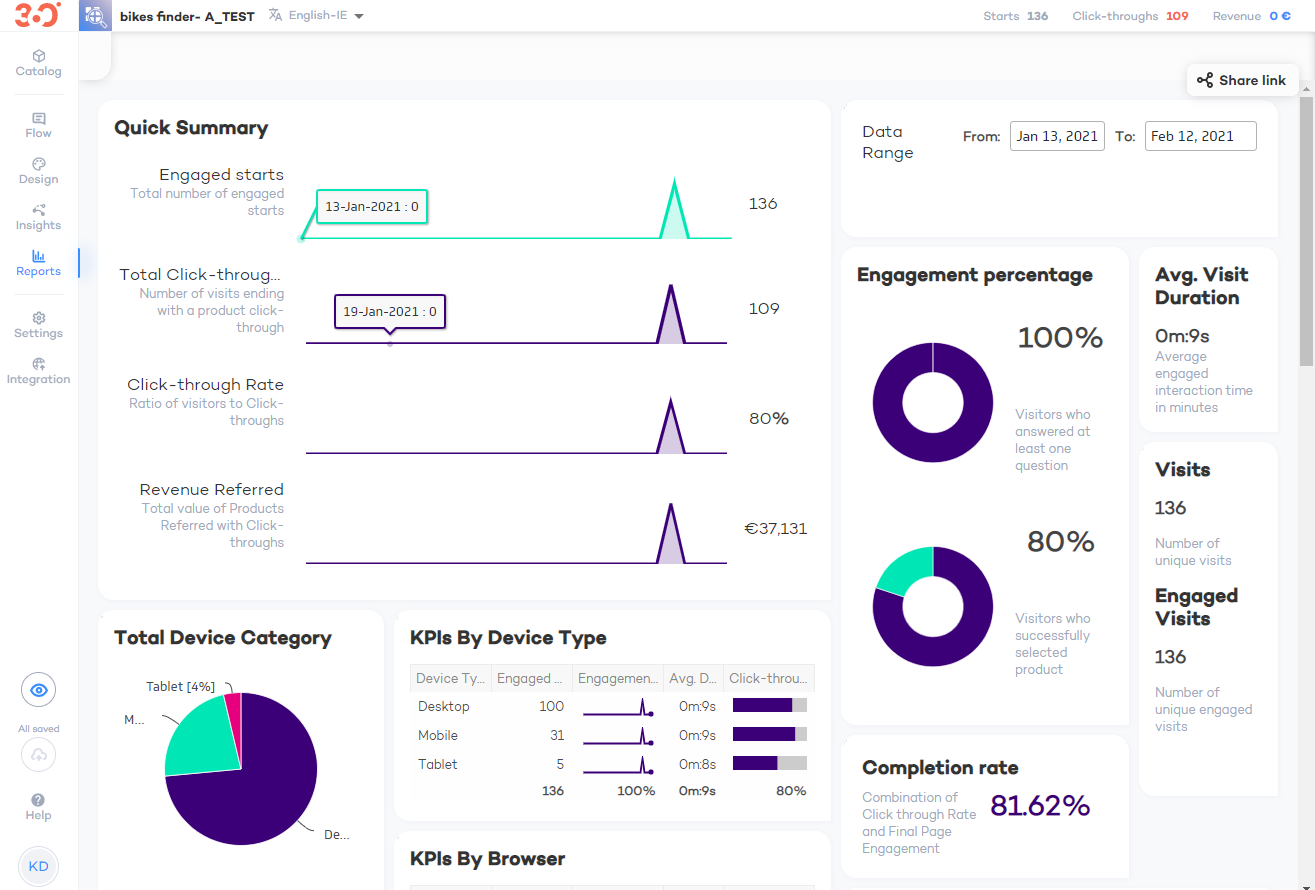
This comprehensive chart (located in the top left corner of the Overview report tab) provides insight into the general performance of your digital Product Finder.
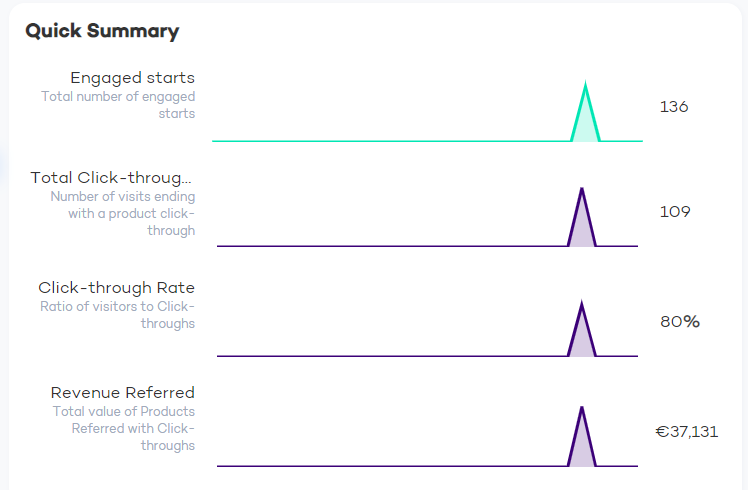
Product Finder 360 Starts: Total number of Product Finder 360 Starts on a specific day and within the whole time period
Total Click-throughs: Total number of Click-throughs on a specific day and within the whole time period
Click-through Rate: Percentage of visits that ended up with a selection of a product (from all engaged visits).
Revenue Referred: Total value of the products viewed by the visitors from the Product Finder
| Each value is displayed for the whole reporting period and can be viewed for a specific day. To see the value for a day, hover the mouse to a point on the chart axis | 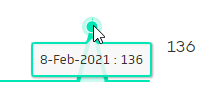 |
Customer Engagement Reports
To the right from the Quick Summary, there is a set of reports that will help you asses the overall engagement of the visitors with the Product Finder during the reporting period.
Engagement percentage: the upper donut graphs, that show for which percent of the total visits at least one question was answered. Click-through Rate: the donut graph just below. Shows the percentage of visits that ended up with a selection of a product (from all engaged visits). Below the donut graphs, is the Completion rate, i.e. the percentage of visitors who either selected a product or reached the final page of the Product Finder. | 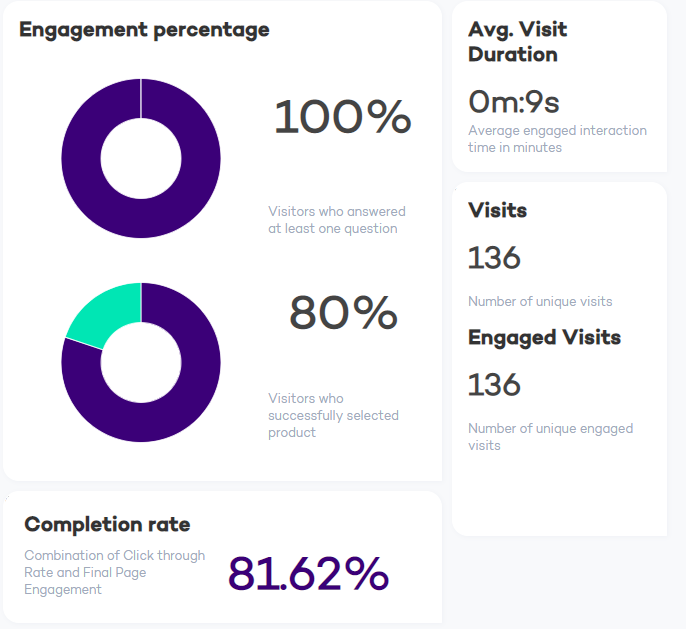 |
To the right are:
Average Visit Duration: Total time of the engaged visits divided by their number
Visits: Number of all visits during the reporting period
Engaged Visits: Numer of all engaged visits (at least one question was answered)
Device and Browser Reports
The section is dedicated to the Product Finder's usage on different devices and via different browsers. It's usually located below the Quick Summary chart.
Total Device Category and Browser Share
With these easy-to-comprehend pie-charts, you can get an insight on the specifics of your visitors and adjust the Product Finder correspondently. The Total Device Category report considers three types of devices:
The Browser Share chart will include all the browsers that have been used for engaged visits. Both reports are generated using totals for the reporting period. |  |
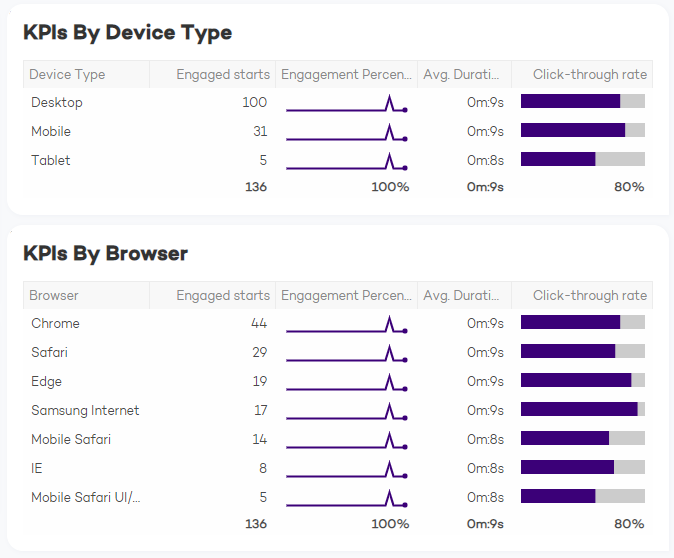
KPIs by Device Type and by Browser
With these table reports, you can get a deeper insight into the usage specifics, and check if the Product Finder lacks efficiency when used via a specific device or browser.
The following KPIs are provided for each device category and browser:
|  |
KPIs Report
| This generalized view of the KPIs for the reporting period. The report shows how the number of visits and engagement rate have been changing during the reporting period. | 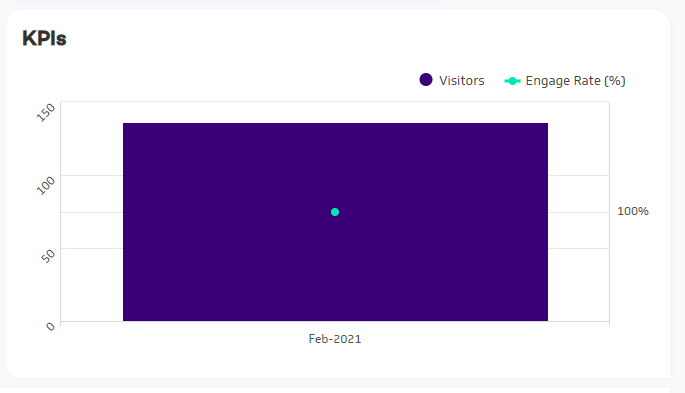 |
Product Reports
Go to the bottom of the page to learn which of the products have been the most and the least popular with your customers.
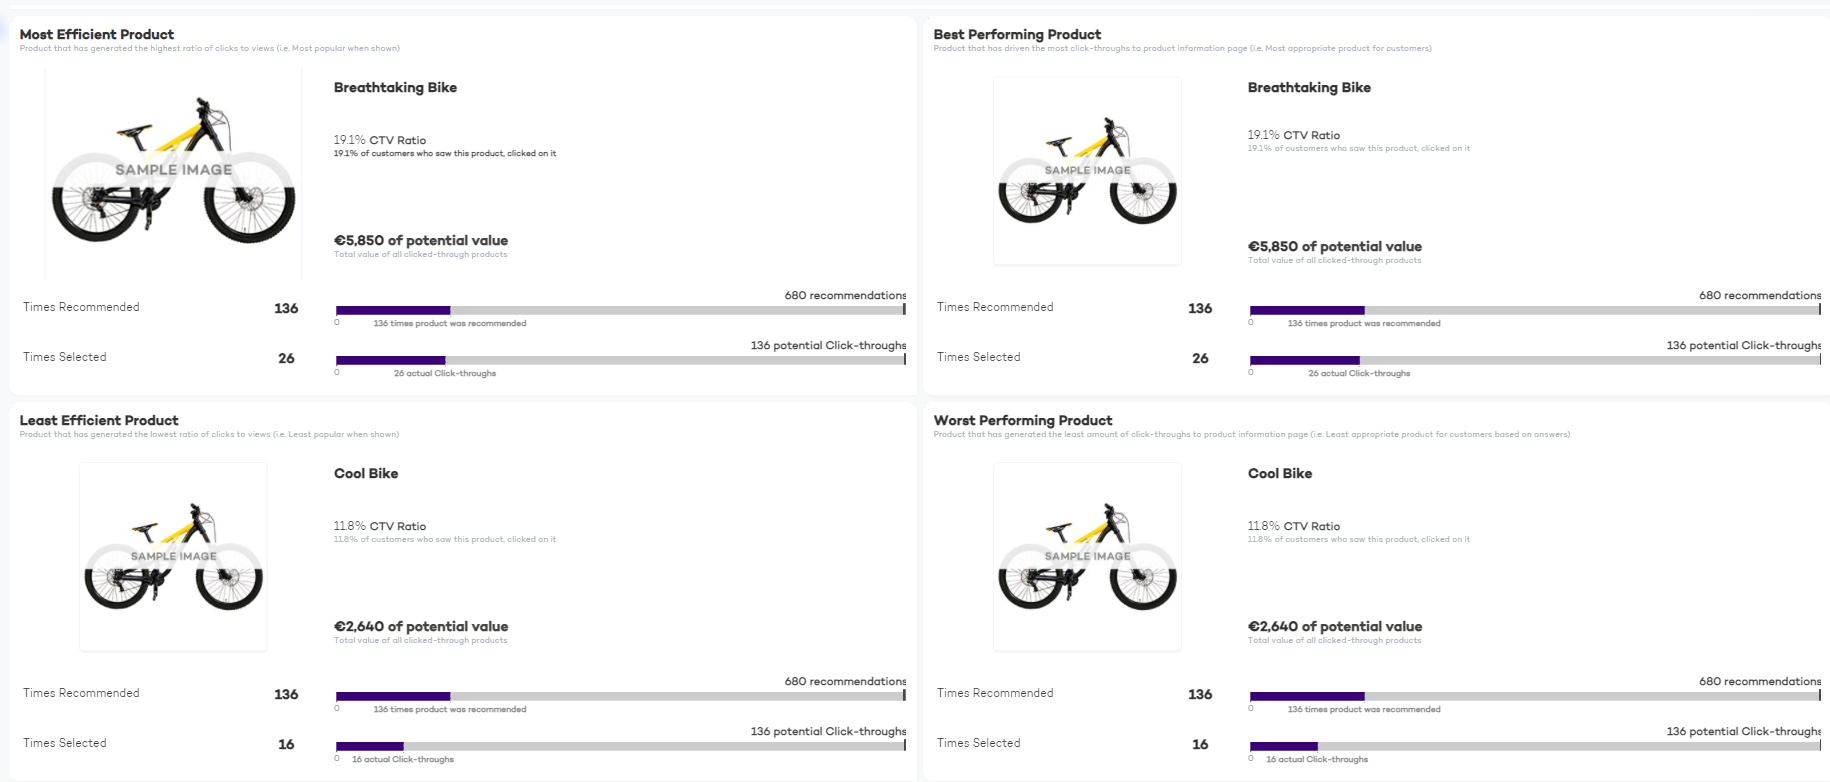
As you can see, the report shows:
The Most / Least Efficient Product: The product with the highest / lowest ratio of the times the product was selected to the times it was recommended.
The Best / Worst Performing Product: The product that has been selected most / least frequently in the reporting period.
Imagine, that some very specific product appears in the Product Finder quite rarely, but when it does, the visitors usually proceed to view its details - it won't be the best performing but will be the most efficient.
For each specific product, you can see:
| 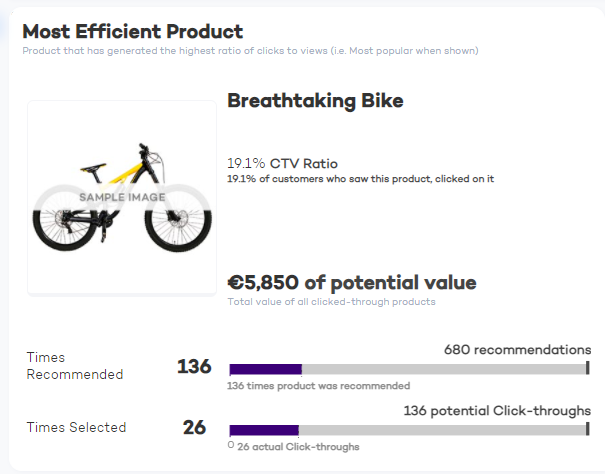 |
You can also see, what values used to calculate the CTV ratio, i.e:
Times Recommended: how many times the product has been displayed in the Product Finder
Times Selected: how many times a visitor has clicked to view the product details or added it to the cart
Change Reporting Period
| You can always redefine the reporting period of the Overview Reports. This is done in the calendar in the top right corner of the tab. | 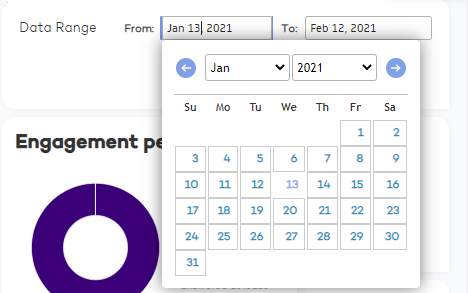 |